
Media Monitoring - Step By Step
Media Monitoring Handbook
Table of Contents
Introduction
Since 2015, the International Republican Institute’s Beacon Project has been working with civil society organizations and political stakeholders across the Euro-Atlantic space to respond to the threats malign actors pose to our democratic norms and institutions. This has taken the form of a three pillared approach of building coalitions of local civil society partners that conduct credible research to inform policy makers.
At the core of this approach is the special attention the Beacon Project pays to in-depth data-driven analysis of disinformation sources and narratives as well as the impact these campaigns have on society. To achieve this the Beacon Project has been providing its coalition of CSO partners with media monitoring tools and methodological principals to facilitate local-CSO-lead research on the media environment. In 2016, the Beacon Project developed a unique proprietary media monitoring tool, >versus<, which focused on scraping online media content from Central and Eastern Europe (CEE) when other commercial tools were still focused on the larger markets. However, over the years commercial media monitoring products have considerably improved their capabilities in the CEE media space, which resulted in IRI retiring the >versus< monitor in favor of an advanced commercially available tool provided by Pulsar.
Despite no longer having the custom proprietary media monitoring tool, the Beacon Project remains committed to lowering the bar of entry to organizations and researchers interested in contributing to the understanding of malign information activities. By providing access to the Pulsar media monitoring tool and holding trainings and workshops the Beacon Project seeks to continue supporting both new and veteran researchers alike.
This guide serves as a basic starting point for researchers interested in conducting media monitoring but are not sure where to start as well as those looking to ensure methodological best practices are being applied. In addition to the fundamental steps outlines in this guide, it is being presented in an online platform to enable further updates and insights from the diverse research community focusing on media monitoring.
For those interested in conducting media monitoring research on Pulsar through collaboration with the Beacon Project, you can register your interest by completing our partnership form.
How to use this guide
There are many great resources that cover different aspects of media monitoring, therefore, this guide seeks to prevent duplication and instead provide more practical steps that media monitors can follow to obtain and work with the data.Additional tutorials on specific aspects of content acquisition, data cleanup, analytical techniques, and visualization will be added.
For more historical background, case study reviews, and theory behind media monitoring consult the following published content.
|
Title |
Publisher |
Published Date |
|
Monitoring of Media Coverage of Elections: Toolkit for Civil Society Organisations |
Council of Europe |
November 2020 |
|
NATO StratCom CoE |
December 2020 |
|
|
Countering Information Influence Activities: A Handbook for Communicators |
Swedish Civil Contingencies Agency |
March 2019 |
|
Digital Democracy Monitor |
|
|
|
How to Analyze Facebook Data for Misinformation Trends and Narratives |
First Draft |
May 2020 |
|
Guide for Civil Society on Monitoring Social Media During Elections |
Support Democracy |
August 2019 |
|
Democracy Reporting International |
June 2020 |
|
|
National Democratic Institute |
May 2020 |
|
|
A Field Guide to ‘Fake News’ and Other Information Disorders |
Public Data Lab |
April 2019 |
|
UK Government Communication Service |
2019 |
|
|
Handbook on Media Monitoring for Election Obersvation Missions |
OSCE: ODIHR |
2012 |
|
Election Coverage from a Gender Perspective: A Media Monitoring Manual |
International Institute for Democracy and Electoral Assistance |
February 2011 |
|
Media Diversity Institute |
2003 |
What is Media Monitoring?
Media Monitoring has long existed in various forms and applications.1 Over the years it has evolved from printed newspaper clippings to massive datasets that can exceed multiple petabytes of data. The change in what is available and to whom means that media monitoring offers nearly limitless possibilities in how it can be used. In essence it entails the examination of a substantial amount of content published in a given media environment to gain insight into what is being presented.
There are three distinct media types that can be monitored depending on the purpose and resources available: Print, Audio-Visual, and Online 2
Project’s like the Global Database of Events, Language, and Tone (GDELT), Lockheed Martin’s Integrated Crisis Early Warning System (ICEWS), and the Open Event Data Alliance (OEDA) leverage big data and automated coding techniques to view global scale data on events based on what is reported in the media. These have been used to better understand the impact of events, like conflict and access to power, and have been used in an efforts to predictforecast emerging conflicts. Media monitoring is also commonly employed by organizations on a smaller, more localized scale to verify integrity of elections, manage organizational and personal reputations, track the reach of malign narratives, support open-source intelligence (OSINT) investigations, fact-checking, and other types of disinformation research.
This guide focuses on online media in the form of websites, blogs, and social media. Although print publications are becoming increasingly digitized and automated transcription services bring TV and radio broadcasts online, access to these services are often still limited for many organizations wishing to conduct media monitoring due to geographic and financial limitations.
Media Monitoring as a Research Method
Media monitoring is a robust research method that can be employed to obtain extensive qualitative and quantitative data that helps to explain our world and the events that shape it is just one of many available research methods and depending on the case may not be the most appropriate. The primary function of media monitoring is to identify and record what is being presented in the media. At the outset, there should be an evaluation process to. The logic of choosing it must be guided by the questions being asked and the type of outputs being produced.
Media monitoring can be used to identify narratives presented by different outlets; however, it often fails to explain the editorial processes or ownership structures that resulted in those stories being presented.
Armed with data indicating suspicious publishing activity, the next step may be more in-depth research which seeks to prove links and ownership structures between multiple outlets or social media profiles. Media monitoring excels at exploring large amounts of data to discover trends and other patterns that may be significant.
In the example from Google, the search parameters are only a date range with the News section of google search selected.4 This returns all the sources that Google indexes under its “News” label, between 01 November 2019 and 01 January 20205, resulting in approx. 340 million mentions across the globe. Since Google is searching through much of the open internet, there are too many results to go through and it will contain too much noise to be useful for any research.
As most monitors are working in specific regions or languages, it is less relevant to do such a broad search in the first place. Therefore, when looking to identify relevant topics, it is useful to refine the scope of the search as well.
One way to limit the results is by a specific country, language, top-level-domain (TLD), or site depending on the query building capabilities of the tool being used.
Building off the previous Google query, it is possible to refine it by adding a TLD or a specific source directly into the query.

Research Questions
For many of the researchers and analysts in the counter disinformation community, the goal is not research for research’s sake, but rather fulfil specific objectives laid out in mission statements or project proposals. They may be to inform policy makers through publications and briefs, capacity building for other organizations, or identifying and countering false information. While organizations with secure and stable funding can often explore more of the theoretical aspects of the research and produce thought provoking and interesting academic studies, many in the community are bound to annual funding cycles that prioritize more immediate, practical outcomes. For this reason, the outcomes and audience should remain at the core of any consideration to conduct media monitoring activities. To put it simply, who is the audience for the findings and how will they benefit?
Though basic questions, these are often taken for granted and not always the guiding principles of the research. They should be thought back to at each step of the process to remain at the forefront of the work being done.
Example of Questions:
- Are consumers of the media receiving unbiased coverage of [topics/people/groups]?
- Are foreign media outlets influencing domestic media coverage?
- Are certain topics/narratives being disproportionally covered by media outlets?
- How widespread are false narratives in the wider media environment?
- Where does false information exist in the media environment?
Units of Analysis
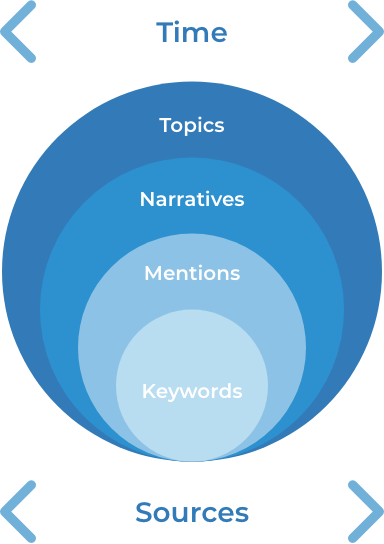
There are many different methodologies which can be employed based on the objectives of the research and the tools available; however, at the core of media monitoring remains a few fundamental units of analysis:
Time: The time period in which the media will be monitored.
Sources: the scope of the sources that will be monitored.
In the most basic approach to media monitoring, a researcher may choose to define only a time range and number of sources and review all the results to understand what is being said. This can be defined as a more exploratory approach to media monitoring and can be a useful first step to determine where more detailed research may be required. This can be particularly useful when working in an unfamiliar media environment or beginning to study a new topic.
In addition to defining the time and sources, there are also descriptive units which can be equated to layers in an onion; a core of individual keywords build toward more complex concepts researchers are seeking to monitor.
Keywords: Individual words or phrases that are used to query or filter the media content to improve the relevance of returned results.
Mentions: Specific articles or posts that mention the keywords being queried and, therefore, have a higher degree of relevancy.
Narratives: A set of related themes present in the mentions that seek to push a specific perspective or rhetoric within a set of articles or posts. Sub-narratives may also be identified that take distinct approaches to supporting the overarching narrative.
Topics: A subject or theme which can be used to categorize and describe the narratives being analyzed.
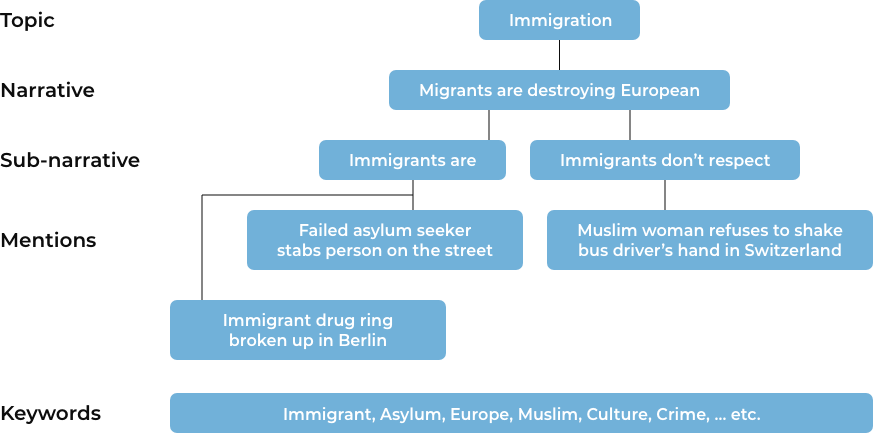
Above is an illustrative example adapted from real content to show how various descriptive units integrate to form the concepts being researched. In this example, assume the research goal is to identify anti-immigration narratives in the wider discussion of the so-called European migration crisis. The objective might be to better understand the connection between anti-immigration narratives in the media to policies and statements from extremist political movements. This rhetoric can have implications for how more moderate political campaigns speak to their constituents or for fact-checkers to prepare debunking material ahead of future elections.
Considering the goal is to identify anti-immigration narratives within the broader discussion on the European migration crisis, some initial keywords can be created through a short brainstorming and basic knowledge of the larger debate. In the example, keywords such as “immigrant, asylum, Europe, Muslim, Culture, Crime”. These are some keywords that are likely to come up in content trying to promote a perception that immigration is having a negative impact on European society. Above we have an example of three mentions that may be returned. Each of them contains one of the keywords and represents an article or post that is likely to lead to or support broader anti-immigration rhetoric in the form of sub-narratives, such as “immigrants are criminals” or “immigrants don’t respect European values”. These may be as far as the narratives go, or they could also lead to a further over-arching narrative such as “Migrants are destroying European culture”.
Use Cases
While the simple scenario above describes one potential use case, it assumes that a desired topic has been chosen. In some cases, like when working with a new or unfamiliar media environment, it may be necessary to begin by identifying topics of interest present in the media. Once topics have been identified, they can be further explored to better understand the underlying narratives associated with them.
While the exact formatting of search parameters may differ depending on the tool being used, the general principals and logic remain the same. For the below examples, queries using Google and a modern commercial media monitoring tool, Pulsar, will be used. These two tools cover many of the standard functions that would be found in other media monitoring tools. The Pulsar Platform provides a robust media monitoring solution that is available to all Beacon Project partners and can be an advanced solution for those that do not have their own tools.
Exploratory Research: Getting Started with the Data
Data Collection
Often one of the first steps in media monitoring research is to gather broad initial data to better understand the media environment before more refined monitoring can take place. This is essential for new media monitors who may not be familiar with the environment and is useful for seasoned researchers to ensure new insights are not overlooked.
Getting started can be easily achieved by utilizing some simple Google search tips. The most basic technique to start monitoring media is to begin with the two fundamental units of analysis: time and sources. Regardless of your research purposes, it will be required to define these two variables. For example, it may be of interest to know what is being discussed in a particular time period across all monitored sources. 3 This will vary depending on the tool being used for media monitoring.
Google search query: “after:2019-11-01 before:2020-01-01”
Returns: all Google results between 01 November 2019 and 01 January 2020
In the example from Google, the search parameters are only a date range with the News section of google search selected. 4 This returns all the sources that Google indexes under its “News” label, between 01 November 2019 and 01 January 2020 5, resulting in approx. 340 million mentions across the globe. Since Google is searching through much of the open internet, there are too many results to go through and it will contain too much noise to be useful for any research.
As most monitors are working in specific regions or languages, it is less relevant to do such a broad search in the first place. Therefore, when looking to identify relevant topics, it is useful to refine the scope of the search as well. One way to limit the results is by a specific country, language, top-level-domain (TLD), or site depending on the query building capabilities of the tool being used.
Building off the previous Google query, it is possible to refine it by adding a TLD or a specific source directly into the query.
Google search query: “after:2019-11-01 before:2020-01-01 site:.lv”
Returns: all Google news results between 01 November 2019 and 01 January 2020 that use the TLD “.lv” in their URL.
Searching by TLD can be useful when attempting to search for content from a specific country. Each country has their own country-code top-level-domain (ccTLD) which can identify sites more relevant to the given country. As a result, adding a clause to search within the “.lv” domain will result in content that is more likely relevant to Latvia, since .lv is the ccTLD. 6
Keep in mind that many sites relevant to a country will not use a the designated ccTLD as they may use “.com”, “.net”, “.news” , “.ninja”, etc. while others may use a ccTLD in more creative ways, such as the Polish based news site Outriders, which uses the Serbian ccTLD for their website Outride.rs, or the useful Canadian data analytics company Plot.ly, which uses the ccTLD for Libya (.ly).
If you do not understand the language of the returned results, text can usually be translated in your browser by using the Google translate browser plug-in. If using the Google Chrome browser, right click and select “translate to (your browser language). When there are multiple languages on one page, selecting the origin language as “unknown” will attempt to detect each language present and translate to your language.
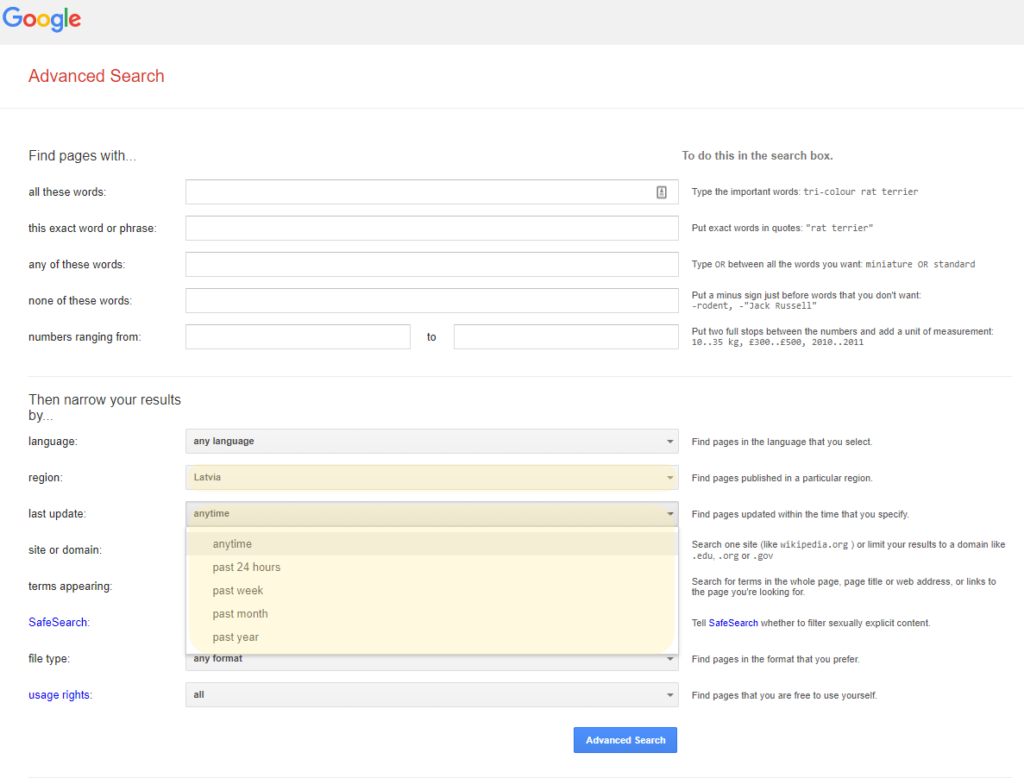
To search for a page that is based in a country without using the ccTLD, there are other options, including using the country filter on Google’s Advanced Search or by URL hacking (editing the search query’s URL manually). While more complicated, the benefit of URL hacking is to bypass some of the limitations on Google’s advanced search interface.
For example, Google’s Advanced Search is limited to selecting pre-defined timeframes and only one country via its drop-down menu; however, it is possible to edit the URL directly in your browser to search multiple countries. 7
Using the original search query “after:2019-11-01 before:2020-01-01” and navigating to the News section, we will add to the URL “cr=countryXX&”, which will limit results to a specific country.
For example, let’s limit the results to Latvia without using the ccTLD (.lv), instead hacking the URL by adding the ISO-Alpha-2 code for the Latvia (LV):

The results on Google now display all the results of the query that it recognizes as being form Latvia. Single country filters can also be achieved using Google’s Advanced Search interface and selecting Latvia from the drop-down; however, the benefit of editing the URL directly is you can easily add multiple countries.
For example, now let’s change this to include all content from Latvia and Lithuania by editing the previously added code:


By putting the end of the code in a bracket and using the OR pipe (|) operator, Google returns results from either Latvia OR Lithuania.
By limiting the results to specific countries, the number of results is substantially reduced and are more likely to be relevant to the country being researched. However, the results are still likely to number in the tens of thousands. This is still too many results for a researcher to effectively monitor and will include significant amounts of irrelevant topics, potentially missing important sites that may not be attributed to being from the specified country (such as Russian based sites that are popular amongst Russian speakers in Latvia or Lithuania). Although it is dependent on the use-case, it is likely that additional parameters are required to get more manageable and useful results.
Since many organizations conduct media monitoring to support countering foreign malign influence by finding known foreign state-sponsored narratives or disinformation, it may be useful to limit the initial search queries to a specific site that is already known to be a publisher of this type of content. This makes it easier to identify the topics and trends that these outlets of interest are publishing and can inform future research, such as locating similar narratives in other outlets.
Google search query: “after:2019-11-01 before:2020-01-01 site:sputniknewslv.com”.
Returns: all Google results between 01 November 2019 and 01 January 2020 that were published by www.sputniknewslv.com.
When searching a specific site, there should be no difference in the returned results under “News” or “All”. The query is already limited to the specific “news” site in this case so the only difference will be the formatting. While searching for news content, results under the “news” section is more intuitive as it displays the Headline in addition to a preview of the Body of the post.
By limiting the above query to just look for the official Latvian subsidiary of Russian state outlet, Sputnik News, the number of results are reduced from over 65,000 down to a manageable ~1,100 results. With this number of results, researchers can read through the mentions and get an idea of some of the topics being discussed by this outlet during the time period. Unfortunately, Google does not provide a built-in function to export the results to your local computer in the form of a spreadsheet or text file; any coding of the sources to tabulate topics and trends would need to be done manually by copying the URL and making any notes in a separate file (e.g. excel or Google sheets table). 8
Many expressions in Google search or other media monitoring tools can often be negated using logical operators. For example, to find websites that may be using sputniknewslv.com as a source you can adjust the query by adding a search term of “sputniknewslv” and preceding the site parameter with a “-“ to omit sputniknewslv.com from the results. Multiple sites can be omitted by adding them to the search.
Conducting a similar search in a dedicated media monitoring tool can vary based on the specific functionalities of the tool. Some media monitoring tools enable users to limit the search through whitelisting sources, while others will require other parameters for the search.
If you would like to search multiple specific sites using Google, the most effective method is to utilize Google’s programmable search engine (formerly custom search engine). The user-friendly interface and Help Forum makes it easy to set up. Once it is set up, it works just like Google’s default all-web results but will limit queries to only the listed pages. Multiple custom searches can be stored and even shared with others using a unique public URL or web-embeddings.
Data Exploration/Analysis
Once relevant and manageable data has been returned, it is possible to review the content and begin making notes on some of the key topics being discussed so that they can be more easily recalled later. This process is often called coding or tagging the content and is one of the most fundamental components of effective media monitoring. Given the large amounts of content being monitored, it is impossible for researchers to recall all the most relevant information. Additionally, conscious and subconscious personal bias may impact what a researcher recalls as significant in the data, which can impact the final analysis. By tagging or coding the data, the researcher is providing a descriptor for that text that can be compiled, visualized, and analyzed later.
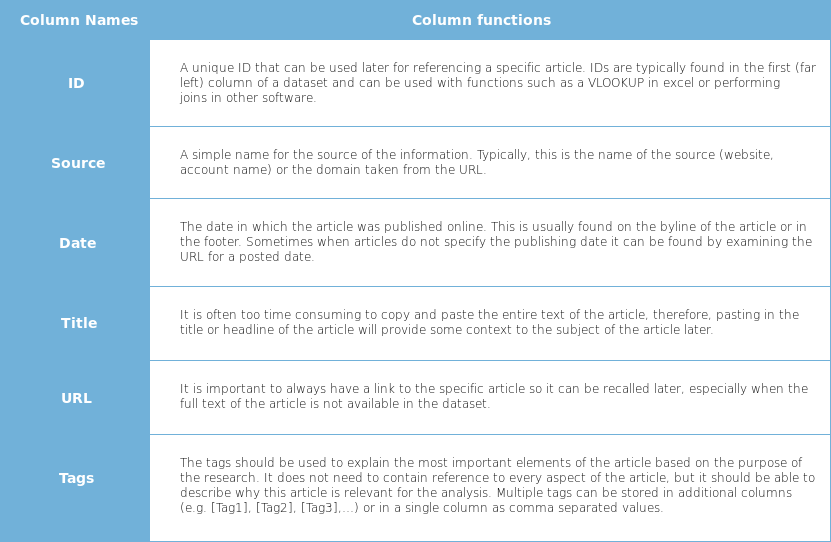
Without the support of dedicated media monitoring tools that have a coding or tagging function built in, this process can be very time consuming. One way of doing this is to create a spreadsheet template to then copy and paste the data and add tags to it. This should have columns for a unique ID, Source Name, Date Published, a Title or sample of the content, URL to the content, and a column to record the relevant codes/tags (for more on code/tag structures see Coding and Methodology Structure).
If media monitoring is to be used regularly or to monitor large amounts of data, then it is suggested that a dedicated tool be used to make this process more efficient. Partners of IRI’s Beacon Project receive free access to professional media monitoring software for use in both joint and independent research activities (see list of other tools). In addition to making your searches more user-friendly than Google, dedicated media monitoring tools usually offer features that are designed to make media monitoring more efficient, such as built-in content tagging and data exporting that make coding and identifying key topics and trends easier.
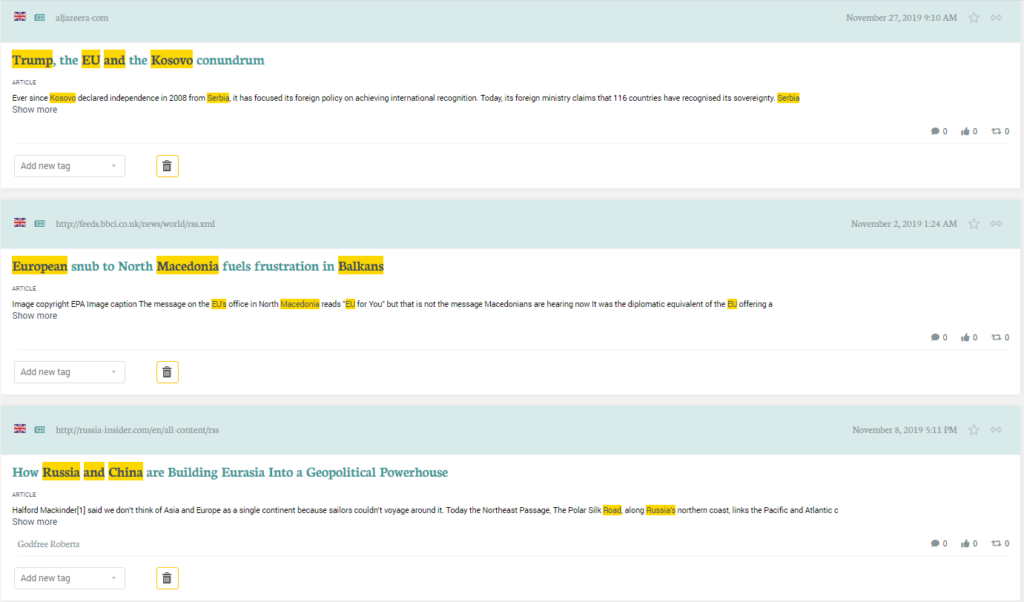
For example, it is often possible to review all the relevant information from an article, including the full text, directly on the platform in a newsfeed format that allows users to quickly review large amounts of data without going directly to each source.
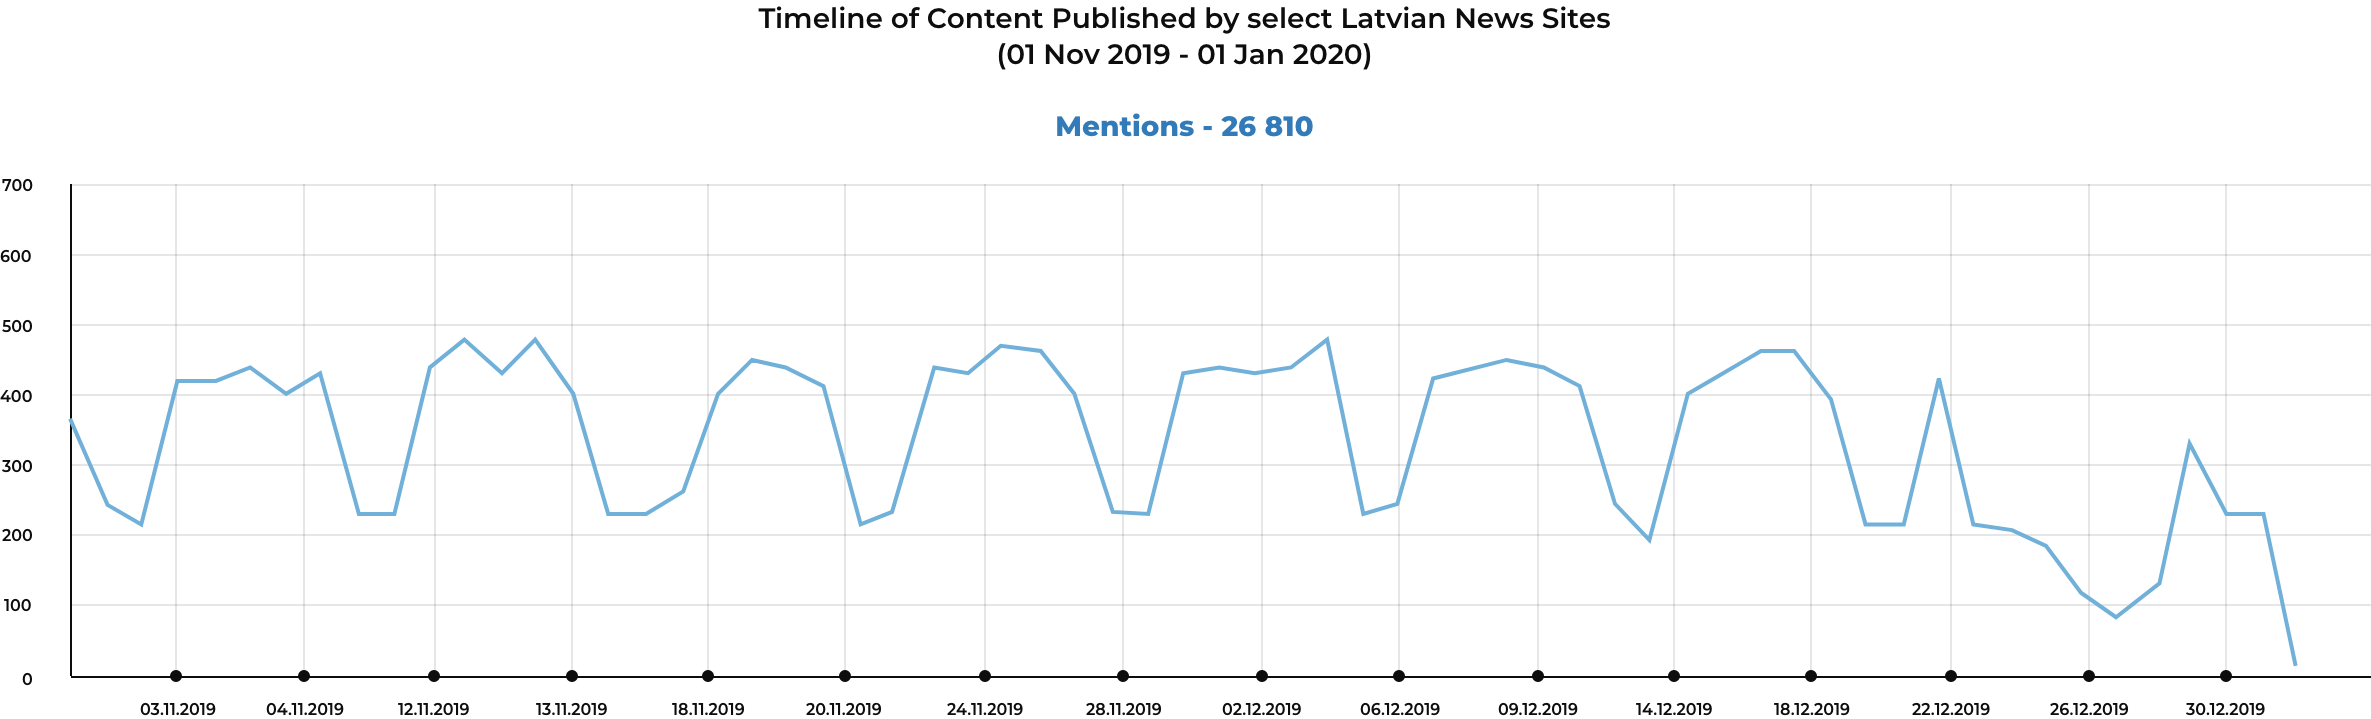
Once the data is stored in a spreadsheet or other dataframe format, it can be visualized in different ways to identify trends more easily. For example, by viewing the number of mentions for the query on a timeline, relevant patterns emerge. In the first example of published news stories without any keywords, a consistent pattern of publications corresponds to calendar events. The number of articles published is noticeably less on the weekends and around the Christmas holiday.
Regular events like weekends and holidays often depress the amount of content published, while other events will noticeably increase the amount of published content. For example, using the basic keyword “NATO” makes it easy to identify potentially significant events that increased the amount of content that referenced NATO.

When doing initial exploratory searches, the peaks are one potential starting point to begin examining and gaining a better understanding of the content.
If the researcher had no idea that North Macedonia was in the process of joining NATO, it would become apparent by reviewing the headlines around one of the peaks (see gold highlighted words). Using basic techniques, like visualizing the text in a word cloud, can give a researcher a quick view of some of the most mentioned words, including references to North Macedonia’s accession into NATO having been ratified. However, another topic which appears more unexpectedly is content discussing the expansion of NATO’s training missions in Iraq (see red highlight).
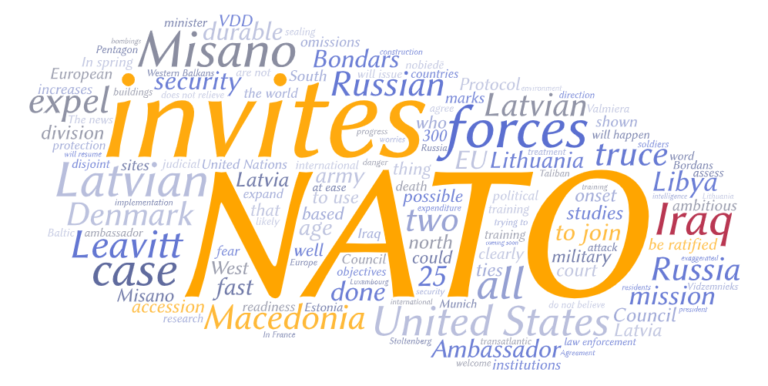
There are plenty of word cloud generation tools available for free online with sites like voyant-tools.org providing multiple analytical results or wordart.com, which offers basic analytical functions but prioritizes design. For full customization, word clouds can be easily created in applications like R or Python.
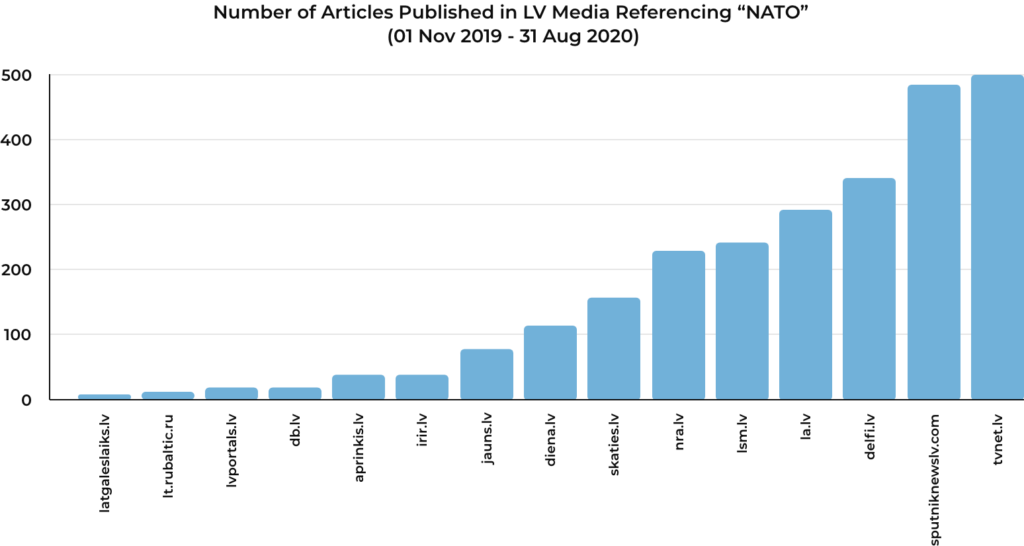
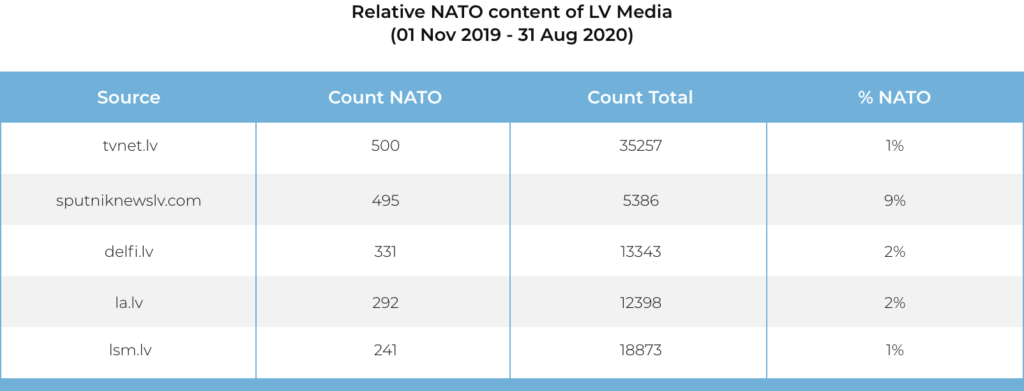
Additionally, by plotting the number of articles published by each source, the researcher can see which media outlets publish the most content containing the given keyword and determine the most prominent sources for more refined research. For example, above we can see the top two media outlets producing content that references “NATO” are TVnet.lv and Sputniknewslv.com. Looking at the overall amount of content each source published without specified keywords, TVnet.lv produces significantly more content. However, only 1% of coverage from TVnet.lv mentions NATO while the rate is 9% for Sputniknewslv.com.
Through this basic exploration the data, it is possible to see the dates with the most content, an idea of some of the main topics being discussed, and the most active sources. This is a great starting point to explore these topics in more detail and identify some underlying narratives.
Exploring Topics and Narratives
Once the research target (source, topic, country, etc.) has been established, using initial data exploration, local knowledge, or predetermined project parameters, topics can begin to be explored in more detail to identify underlying narratives.
For example, the Beacon Project contributed to research done by the NATO StratCom Centre of Excellence and the Atlantic Council of Montenegro focused on the Serbian version of Sputnik News to discover the primary narratives being promoted by the Kremlin linked outlet. In addition to having direct links to the Russian State, Sputnik Srbija is also one of the largest producers of articles that mention “NATO” in the Western Balkan region and, therefore, was a relevant target to examine more closely.
The NATO StratCom Centre of Excellence full series on Russia’s Footprint in the Western Balkan Information Environment is a good overview of a full media monitoring process from initial topic exploration, to topic and narrative monitoring, through to identifying redistribution networks.
Identifying New Narratives
Utilizing simple parameters, the researchers were able to collect the published content related to some of the Western Balkan countries using a media monitoring tool (Beacon Project’s >versus<).
Defining the keywords to use will depend on the research goals, however, remember that ultimately, the results are almost always going to be a sample. It is nearly impossible to ensure that 100% of the mentions related to a given topic will be monitoreddue to the limitations that tools have and the difficulty in distilling complex topics into keyword combinations.
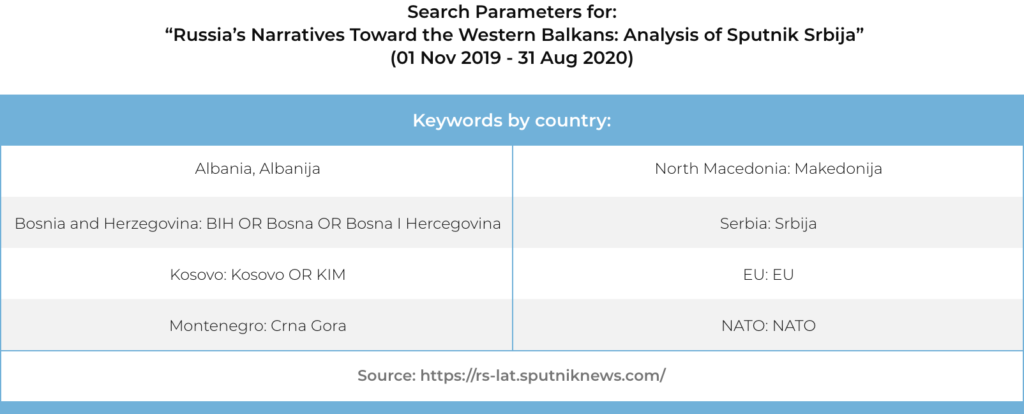
In the example, the keywords resulted in over 11,000 mentions for the one-year period of study. However, some of the topics have a smaller number of returned mentions. Serbia, had the most results, which makes sense for a Serbian outlet; however, other topics had significantly lower numbers of returned articles. This could be due to less coverage of these countries or it could be a result of the keywords being used in the filter.
While most of the topics were given a single keyword in the filter, Bosnia and Herzegovina and Kosovo both received additional keywords to account for commonly used acronyms. Additional keywords could also broaden the filter used for the topics.
For example, the keywords used to find mentions of North Macedonia or Albania could also includ their capital cities, “Skopje” and “Tirana” respectively. The NATO Mission in Kosovo, “KFOR”, may have been a relevant keyword, as some articles may reference the NATO mission by its acronym and not mention “NATO” itself. Additional keywords of government or political leaders could return relevant mentions of the topics.
Depending on the research goals and sources being monitoring, it is important to think through how relevant mentions might be discussed. The choice of keywords is a balancing act between being too broad and too narrow. It is good practice to begin by sampling results with a broad filter and then refine it until a manageable number of relevant mentions are returned. Returned results should always be thought of as only a sample of the overall media environment; ensure this context informs the final analysis.
It useful to take a sample of the mentions from various sources and compare how the key topics are being discussed before finalizing the keywords used for the research. It is common for slang to be used on less formal sources such as blogs or social media posts and different spellings may be used when translating words from one language to another.Identifying unique words, such as places and people’snames, can often help refine the results.
When presenting research findings, there will always be suggestions or criticism on how the research was conducted. Keeping the research goals and limitations in mind and being transparent about the methodology will provide support for the chosen approach and give necessary context to the final analysis.
Tracking Defined Narratives
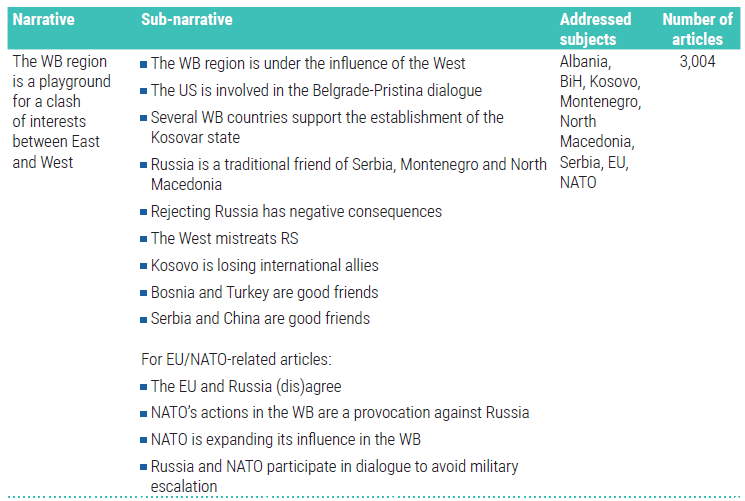
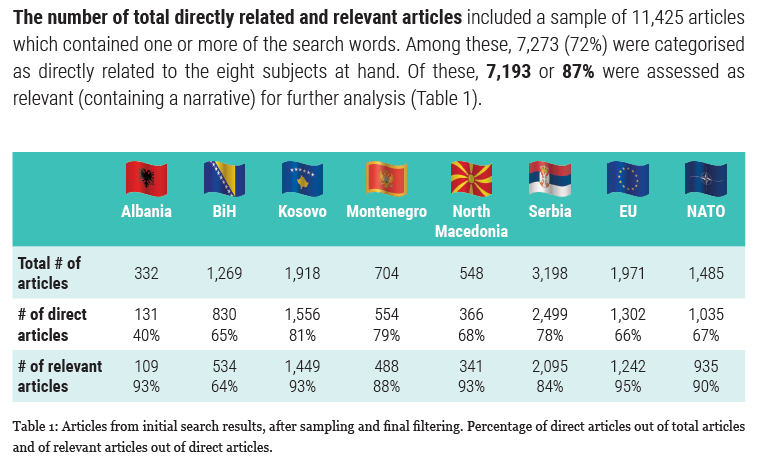
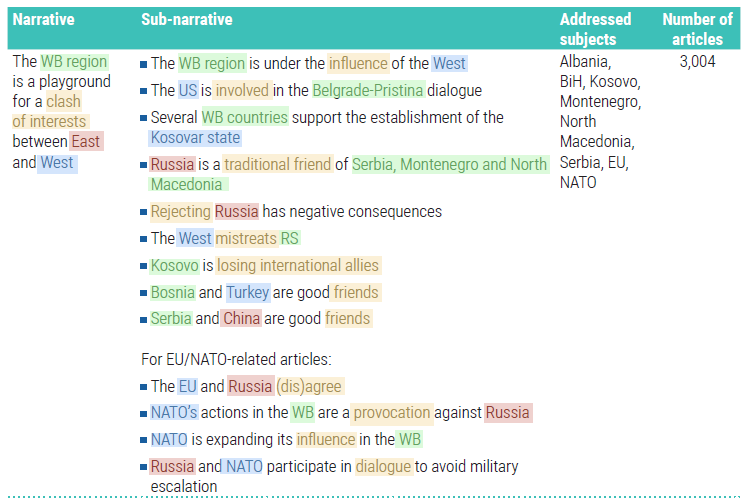
In Russia’s Narratives Toward the Western Balkans, the goal was to track references to countries and institutions and identify any relevant narratives being presented by the predefined source, Sputnik Serbia. Through the review of the over 11,000 articles, the researchers were able to identify nine different narratives along with 50 sub-narratives. While identifying the narratives was the goal of the study, sometimes it is necessary to continue exploring the identified narratives or track known established narratives in a media environment.
To track more nuanced topics or narratives in the media environment it is usually necessary to build out more complex keyword filters to focus the results. Most media monitoring tools and search engines utilize Boolean logic to combine keywords to filter out irrelevant content.
With this logic, complex concepts can be broken down into keywords and linked together using Boolean operators. In most cases, it is possible to begin building the keyword filter by thinking through the various aspects of the narrative and writing down the keywords.

Building off the narratives identified in the NATO StratCom Centre of Excellence study, it is possible to build out a query for each of the narratives. This can catch more instances of the narrative that may have been missed using the original keywordsor track the spread of the narratives in other regional media outlets. To begin, map out the key concepts of the narrative and then write down different keywords likely to be associated with each concept.
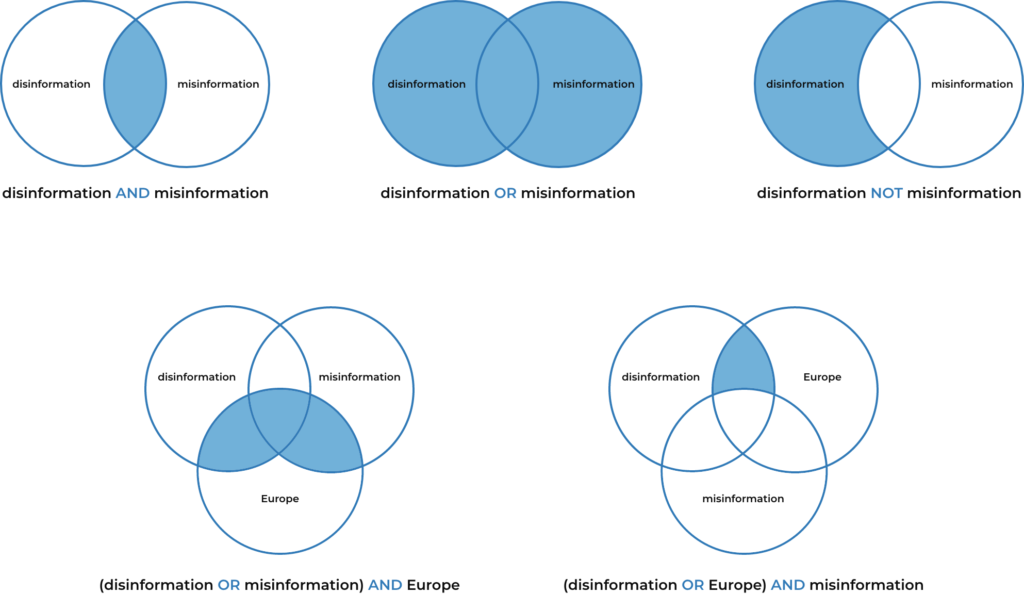
Keyword Filter Construction
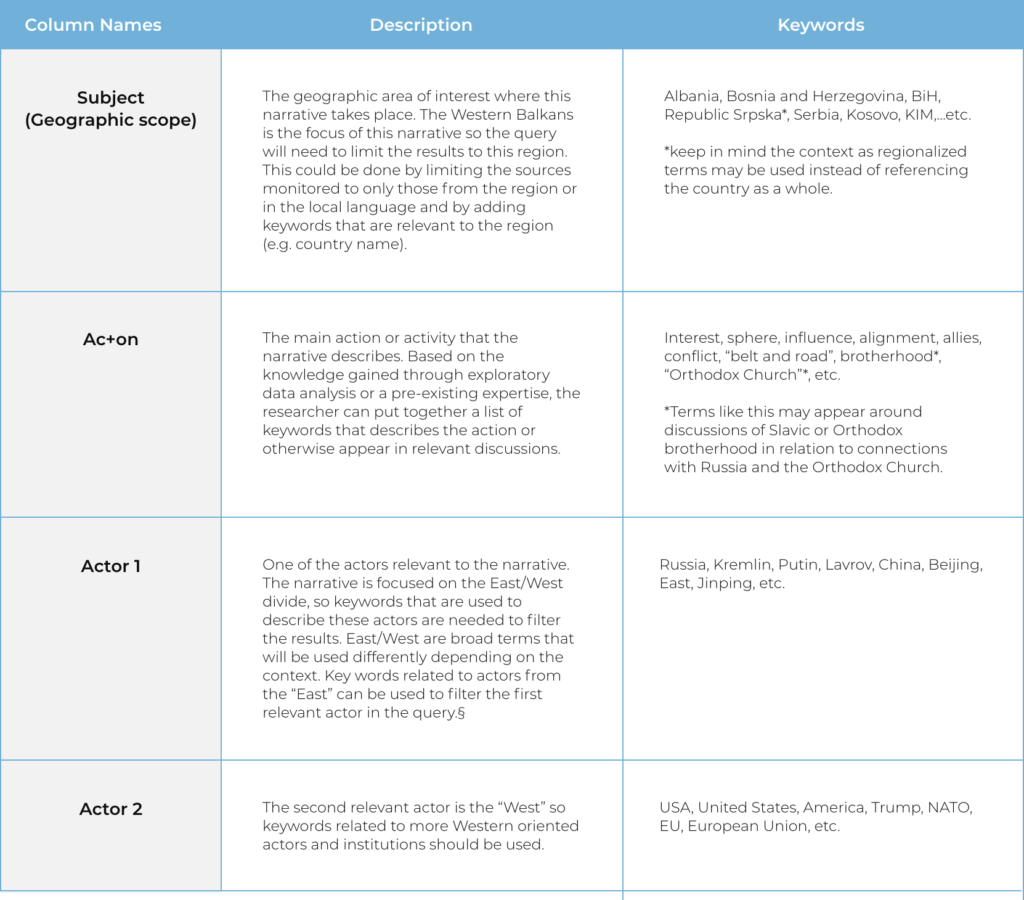
The example breaks one of the narratives in to four concepts: a Subject, Action, and two different Actors.

Following this process, it is possible to begin breaking down all the narratives and their associated sub-narratives.
Breaking the above narrative into its constituent parts helps researchers think through the logic of the narrative and establish keywords.
Once the keywords are listed out, Boolean operators and search modifiers can begin to connect the. The exact formatting of the queries will depend on the tool being used, but the logic is generally the same.
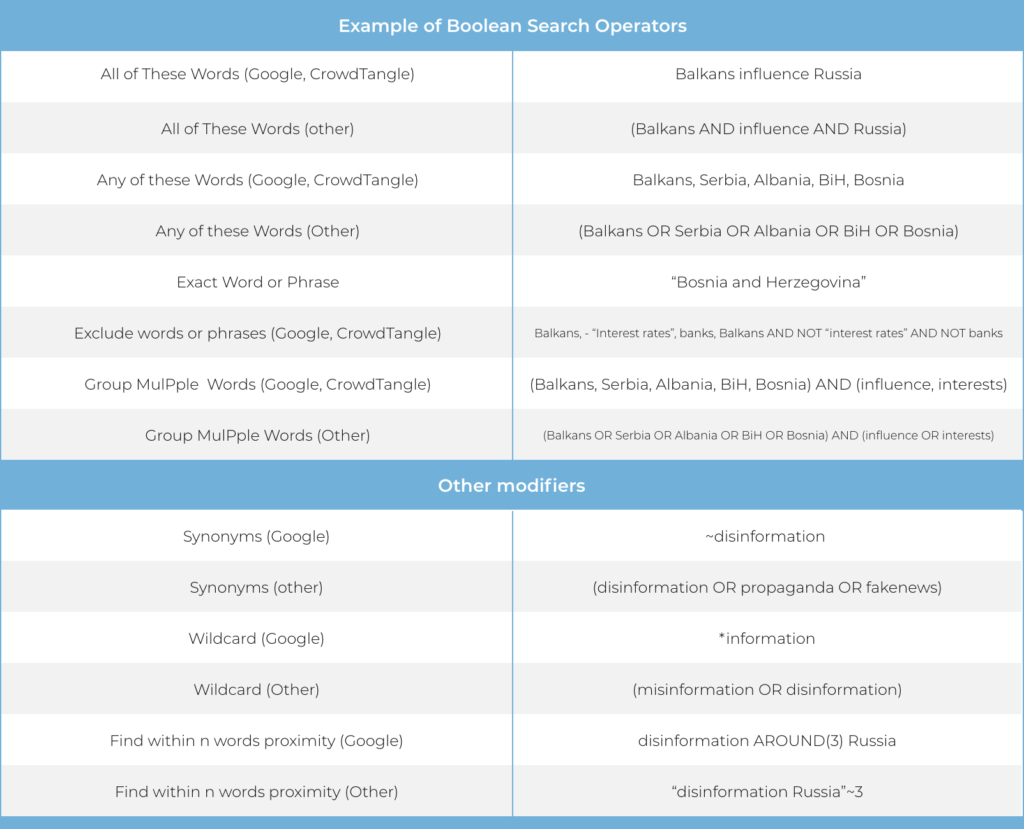
By using the Boolean operators to link together the keywords related to the narrative, filtered results will be more relevant to the research. An example query for the narrative above might be:

In many instances, the words in the query are case agnostic, meaning capitalizing words is not necessary, while Boolean operators must be in uppercase.. Quotes are used to ensure all enclosed words are matched,;for example, references to the word “belt” or “road” are not matching only the phrase “belt and road”. Often the keywords can be simplified. For example, it is common for the countries of Bosnia and Hercegovina and North Macedonia to be referred to as simply Bosnia and Macedonia. Using “bosnia” and “macedonia” are more useful since they will also be matched by the full names “bosnia and hercegovina” and “north macedonia”.
The result must include at least one keyword from the subject, action, and actor clauses.
Lemmatization and Wildcards
When creating keyword filters, it is important to understand how the tool treats the words. While the methods used by Google and other search engines are proprietary, they use techniques to match individual words with all variationsin the given language. One common technique used in natural language processing (NLP) is called lemmatization, which enables the program to match the different spellings of the word to its root (lemma), meaning any version of the word can be used in the query and the results will include all the spelling variations.

Although NLP research is a quickly growing field, the resources available trend toward the larger economic markets, meaning tools may be able to perform lemmatized searches for English, French, and Russian but not for Hungarian or Albanian. This often requires the researcher to enter all the relevant versions of the word needed. When researching in a country that uses multiple languages or alphabets, writing out all the versions of the keywords can get long.
The below example is a query to search for references to Covid-19 vaccines in the Bosnian-Serbian-Croatian language, where both multiple versions of the keywords and the Cyrillic and Latin alphabets need to be accounted for.
|
Pharmaceutical Companies |
(Pfizer OR Fajzer OR Fajzerom OR Fajzeru OR Fajzerov OR Fajzerova OR Fajzerovom OR Fajzerovu OR Фајзер OR Фајзером OR Фајзеру OR Фајзеров OR Фајзерова OR Фајзеровом OR Фајзерову OR Moderna OR Moderne OR Moderninom OR Modernina OR Modernu OR Moderni OR Модерна OR Модерне OR Модернином OR Модернина OR Модерну OR Модерни OR “Johnson Johnson”~3 OR “Džonson i Džonson” OR “Џонсон и Џонсон” OR Sputnik OR Sputnjik OR Sputnjikova OR Sputnjikovom OR Sputnjiku OR Sputnjika OR Спутњик OR Спутњикова OR Спутњиковом OR Спутњику OR Спутњика OR Sinovac OR Sinovak OR Sinovakov OR Sinovaku OR Sinovakovom OR Sinovakova OR Sinovakovu OR Sinovaka OR Синовак OR Синоваков OR Синоваку OR Синоваковом OR Синовакова OR Синовакову OR Синовака OR Novavax OR Novavaks OR Novavaksom OR Novavaksu OR Novavaksov OR Novavaksovom OR Новавакс OR Новаваксом OR Новаваксу OR Новаваксов OR Новаваксовом OR CureVac OR Kjurevak OR Kjurevakom OR Kjurevakova OR Кјуревак OR Кјуреваком OR Кјуревакова OR CVnCoV OR AstraZeneca OR Astrazeneka OR Astrazenekina OR Astrazenekom OR Astrazeneke OR Astrazenekinom OR Астразенека OR Астразенекина OR Астразенеком OR Астразенеке OR Астразенекином OR Sinofarm OR Sinofarmom OR Sinofarmovom OR Sinofarma OR Sinofarmov OR Синофарм OR Синофармом OR Синофармовом OR Синофарма OR Синофармов) |
|
|
AND |
|
Covid-19 |
(covid OR kovid OR kovida OR kovidom OR kovidu OR kovidov OR ковид OR ковида OR ковидoм OR ковиду OR ковидов OR covid-19 OR kovid-19 OR ковид-19 OR SARS-CoV-2 OR coronavirus OR koronavirus OR koronavirusa OR koronavirusom OR koronavirusu OR коронавирус OR коронавируса OR коронавирусом OR коронавирусу OR vaccine OR vakcina OR vakcinu OR vakcinom OR vakcinama OR vakcine OR vakcini OR vakcinin OR вакцина OR вакцину OR вакцином OR вакцинама OR вакцине OR вакцини OR вакцинин OR Cjepivo OR cjepivu OR cjepivom OR cjepiva OR cjepivima) |
TIP: Depending on the tool being used it may be possible to use wildcard(*) modifier to catch different versions of the keywords without typing them all out. Although, this is also may increase the change of false positives that have similar spellings.
Tagging and Methodology Structure
Due to the large quantitie of text being reviewed in media monitoring research, it is importantto annotate and record the findings. This is done through a process called tagging or coding. As the researcher reviews content, they apply a tag to the article using the media monitoring tool or by recording the code in a separate spreadsheet file.
Tagging the content provides multiple benefits to the researcher, such as clearly marking previously reviewed content when working over multiple sessions or within a team, enabling more detailed data visualizations, and easily recalling example data in support of the final analysis or having work peer reviewed.
Although it is possible to utilize automated processes, such as word frequency count or advanced NLP techniques to produce quick insights, they often lack the detail or nuance to be able to provide robust analysis. While automation can be useful at the exploratory state of the research, it will not be able to analyze the content as accurately as a researcher who knows the context and has been trained on the specific goals of the research.
Once the research methodology has been finalized, it is useful to create a code book that details the different tags that should be used. At a minimum, the code book should provide the precise wording of the tag and a description of how it should be applied. There is no single correct way to determine if a piece of content is supporting a narrative or what other concepts are important to tag, so this must be guided by individual methodologies and objectives. It is importantto remain consistent and be able to support the reasoning for a tag being applied.
Good coding practices:
- Keep the tags short, yet intuitive. They should be easy to type and understand to ensure excess time is not wasted and to reduce the chance of typos or misappropriation.
- Specific cases or complex concepts are often better represented by multiple tags. Each tag represents a key element so that individual parts can be analyzed in a broader context.
- AstraZeneca vaccines side-effects and Pfizer vaccines side-effects can often provide more insights by separating them in to three separate tags AstraZeneca, Pfizer, and side_effects .
- If multiple words cannot be typed as one, separate them with an underscore (a_b) rather than a space. This helps applications recognize that it is one tag rather than two words.
- If needed, use a designated character, such as a hyphen, to separate the name of the tag and a given value.
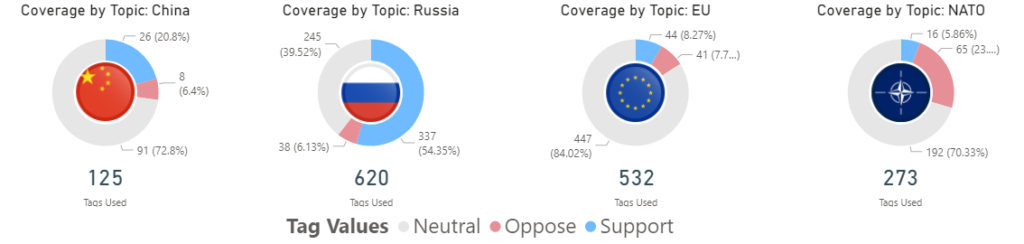
- If researching bias of coverage on NATO, a structure for the tags could be: NATO-support, NATO-neutral, NATO-oppose
- If a magnitude needs to be used to record the intensity of the topic in the content then add it with a hyphen: Corruption-1, Corruption-2, Corruption-3
- Use a pre-defined codebook, but encourage researchers to apply ad-hoc tags to discover previously overlooked concepts.
- Use a ‘n/a’ tag to mark content that is not applicable to the research project. In addition to allowing this content to be filter out of the final data more easily, it also provides an indicator that the content was reviewed and discarded.
- When multiple researchers are reviewing content, have them apply an identifier tag (e.g. their name) to consult the researchers responsible more easily if needed
Visualizing the Data
While some basic visualizations, such as timelines and word clouds, are easily created in the exploratory phase of the research based on non-human coded content, tagged content provides a lot more opportunities to visualize and summarize the data. Media monitoring research is often carried out over large amounts of text to analyzecomplex concepts, so the ability to slice the data based on trained, human coding is extremely valuable. In addition to recalling examples of specific concepts when writing an analysis of the findings, the visuals enabled by the tagged content make it easier to support claims being made, make reports look richer, and provide elements of user-interaction.
Sometimes the connections among multiple concepts are not easily recognizable or understood. Analyzing the coded content may help find these previously unknown connections or provide further evidence of the hypothesized links between them. A simple co-occurrence matrix, which counts each time two tags were applied to the same content, can be done in a spreadsheet application or usingadvanced data analysis tools (e.g. R or Python). Analyzing which tags are most often used to describe the same content provides indication that there may be a connection between the two concepts
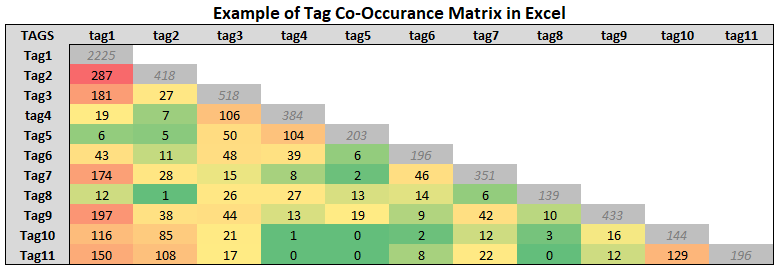
The above example shows that “tag1” and “tag2” appear together more often than any other set of tags, with 287 cases. While this alone is not enough evidence to make any bold claims, it can provide the basis for further exploration. (for details on how to create this see Cleaning up Comma-Separated Tags and Creating a Co-Occurrence Matrix in the Appendix)
While spreadsheet applications like Excel are widely used fordata visualization options,it is useful to utilize additional tools. PowerBI, Tableau, and Google Data Studio are powerful solutions that enable users to explore the data. The real power in these tools is their ability to understand connections within the data, enabling users to interact with the data in a relational way. This allows researchers to select the tag
Case Study: Anti-Semitism in the Western Balkans
Antisemitic Discourse in the Western Balkans is a publication developed by the Beacon Project together with local researchers. This research publication provides a good example of methodology focused on searching for broad narratives existing in online media space of a particular country or region. When it comes to research of narratives,this methodology is distinctive from others due to the balance between quantitative and qualitative components. This helps to form evidence-based analytical conclusions, which takes into consideration a set of hand-coded data as well as broader societal, historical, and legal contexts.
Monitoring of antisemitism in media is often limited to counting and categorizing instances of antisemitic hate speech. Sometimes, researchers also count reporting on antisemitic crimes which happened “in the real world”, such as graffiti on a Jewish cemetery. This insufficient distinction between the purely reporting role and expression of journalist’s opinion is a common mistake seen in media monitoring projects. Media monitoring of antisemitism is also often focused on a limited list of sources, such as Facebook pages of extremist groups. Although this type of focused monitoring does bring relevant results, it can provide a slightly distorted picture revealing isolated, extremist actions of extreme, but missing larger societal trends. Beacon Project wants to provide an alternative to these approaches and go beyond mere collection and classification of antisemitic statements. The emphasis is on better understanding how antisemitic statements correlate with events reported in media and what rhetoric about the place of Jews in Balkan society (narratives). Knowing under which circumstances the media reports about Jews and related topics helped to determine what these narratives are, whether they have a national or international focus, which vulnerabilities they potentially try to exacerbate, and why they do so. Beacon Project’s methodology contained following steps:
1. Clarification of goals: The research followed three goals:to examine how the issue of antisemitism is covered by media in each country, determine the degree to which online media employ antisemitic language, and research the dynamics between the Jewish community and the general population.
2. Selection of sources: wide selection of both mainstream and ‘fringe’ online media and FB pages based in their respective country to get a representative sample of the whole media space. Researchers examined both public and private online media and worked with a total of 341 unique media outlets across the region.
3. Selection of monitoring tool: monitoring was conducted using media monitoring tool >versus<, which recognize all Balkan languages and provides access to balanced mix of online media FB sources, including under-article/post comments.
4. Time scope and keywords: Over a year long time scope has been selected to gain realistic picture of the every day online media space in the region. The longer the period is, the smaller chance of data bias due to random selection of a time period which could be dominated by one major event (such as important anniversary). Test monitoring with keywords is usually an effective way to determine suitable period. At first, researchers tested country specific, explicitly antisemitic language as keywords and revealed only a handful of results per month. Therefore, researchers changed the keywords to more general words that could locate content covering or containing antisemitism (our final query was Jews OR Holocaust OR antisemitism OR Zionist OR Israel in local languages). Their high generality also ensured that monitored content would contain both antisemitic statements and general reporting about antisemitism or Jews in general. This approach turned out to be very useful for Western Balkan region, as many explored antisemitic narratives were very implicit and would not have been discovered without the use of very general keywords and a large enough data sample.
5. Time peaks: Monitoring using general keywords over a long period of time was an ideal solution for most of the countries except Serbia. With Serbia being the biggest media market in the region, the chosen method would require reviewing tens of thousands of online media pieces. To find a balanced methodology suitable for all monitored countries, the research team compromised, allowing researchers to focus on a long period of time but analyze a reasonable number of online media pieces. Instead of monitoring online media content produced on each day of the selected period, the research team focused only on periods (time peaks) that showed the highest concentration of content related to antisemitism (or Jews, more broadly). Next, the research team selected the six highest peaks in each country and researchers were asked to monitor three days before and three days after the indicated peak.
6. Coding (tagging): Application of tags allowed the organization of antisemitic crimes/incidents into categories,differing between content containing antisemitic language and reporting on antisemitism or discussing issues related to Jewish communities. The categorization was based on the widely spread International Holocaust Remembrance Alliance (IHRA) definition, so it could be easily understood by researchers and readers. Besides the IHRA’s categorizationof antisemitic behavior (three main categories were rhetoric antisemitism, physical violence and property damage), researchers also, with discretion, added supplemental tags for international actors (people, organizations, or countries) or specific trends in their country. For instance, a “good relations” tag was used in Albania to calculate occurrences of media mentions stressing good diplomatic relations between Albania and Israel. These additional tags helped to provide quantifiable supportive evidence for conclusions regarding the narratives.
7. Analysis of hand-coded data: Online media-monitoring results from all seven countries were stored and analyzed in an online dashboard created in “Power BI”. Dashboard allowed to explore details which would not be visible without coding, such as list of media most commonly using a particular antisemitic speech or co-occurrence of different types of antisemitism.
8. Identification of narratives would not be possible without data research of each country’s local historical, social, and political background. Desk research and consultation with historians and other experts provided information necessary to better understand the meaning, patterns, and context of antisemitic statements.
Appendix
Cleaning up Comma-Separated Tags and Creating a Co-Occurrence Matrix
In most cases, the tag data will be stored as comma-separated values within a single cell in the ‘Tag’ column of the dataset. These values will often be treated as one single value, meaning that if the cell contains three tags (tag1, tag2, tag3) the application will believe it to be one tag = “tag1, tag2, tag3”, rather than 3. This will make it difficult to compare the tagged results of the media monitoring. To solve this problem, it is necessary to clean up data by splitting eachtags. This can easily be done using Excel’s text-to-columns function, however, it will be easier to analyze the results when they are in a long data frame format with only two columns (ID and Tags).
Excel:
Thankfully it is very easy to clean up our data to achieve the new format we need. The example dataset provides some of the basic variables that are often useful in media monitoring research but can of course include far more collected datapoints as required for the analysis.
Step 1:
To clean up the tag data we start by sub-setting the original data to focus on just the ID and Tag variable. This isdone by simply copying the ID and Tags columns and pasting them into a new sheet or workbook.
Tip: When cleaning up the data, it is useful name your new data frames right away so you don’tdo not forget what that data is. For example this is now our ‘tag_data_step1’ data frame to distinguish it from our original ‘master’ data. It is a good ideasmart to always keep your original master data separate from your clean up data, as to so you do not accidentally remove useful data. Using a unique ID it will always be possible to re-populate data from the master file if needed.
Step 2:
Select all the data in the two columns and select From Table/Range from the Data tab to create a new power query table.
This will open Excel’s Power Query Editor ,which will allow us to easily clean up the data. Once the editor opens, select the Tags column and then select “Split Column by Delimiter” from the drop-down menu.
This will give you options to choose the character (delimiter) you want to use to separate the values. While comma is a default option, note that in the sample data the tags are separated by a comma AND a space! To save a step of removing these extra spaces later we can select a Custom delimiter instead and type in a comma plus a space (“, “). Under the Advanced Options, select rows, since we want each tag to be in a new row with its associated ID copied along with it. Now, a list of all the IDs multiplied by the number of tags associated with them is left. Click on “Close & Load” to add this new table to your workbook.
Step 3: Tag Count
Counting how many times each tag was used can now be done in a few ways. One of the easiest ways is using the Pivot Table function to create a new table based on the number of times a tag appears.
Step 4: Tag Occurrence and Cooccurrence
In addition to the absolute number of tags, it is also possible to count how often the different tags appear on the same mention. This calculation is often referred to as co-occurrence and can be easily calculated with a few simple steps.
Excel will often provide assistance by predicting relevant ways to analyze the data. While in the previous example the pivot table was created manually, depending on the data, it may be possible to let Excel select“Analyze Data”. This function will examine the data on the sheet and select options. For this analysis, select the option with the ID as rows and each of the unique tags as separate columns.
Notice that the Analyze Data function provides two options, including a version of the calculation done in the last step. While the automated function can save time, it may not provide you with the required option; but it can be created by dragging and dropping the variables in to the relevant fields in the pivot table design window too.
This table converts each of the named tags into a count. 1 means the tag is present while a blank indicates that tag was no associated with that particular mention (distinguished by the unique mention ID). Converting the words in to digits makes it easier to count.
Once the data is set up from the process above, it is easy to also calculate the co-occurrence of tags. This type of analysis is useful in discovering associations between different tagged concepts in the data.
For example, if researching disinformation narratives associated with migration, tags used to label a mention about a specific politician and those used to label a defined narrative can be used to discover a possible association between the politician and the narrative. This can be useful in discovering previously unknown associations or to provide further evidence for an expected result.
- Create a blank matrix with each tag representing a row and a column (paste and transpose functions are useful) 2.
- Once the blank matrix is created, a COUNTIFS formula is used to count when two tags are present in the same mention.